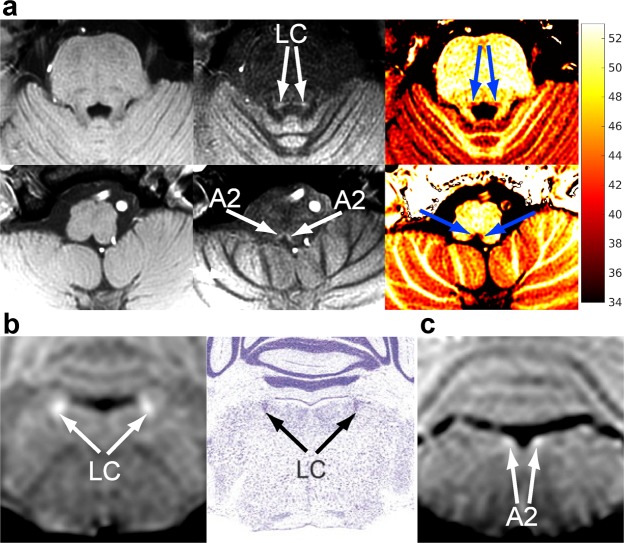
Figure 6.
Magnetization transfer delineates noradrenergic neuron groups in the brainstem of human and mice in vivo. (a) (Top row) Transversal T1-weighted MRI (3T, spoiled 2D FLASH, TR/TE = 863/4.4 ms, α 70°, (0.66 mm)2 in-plane resolution, 2.5 mm slice thickness, 21 slices, total acquisition = 9 min 11 s) of the locus coeruleus and (bottom row) A2 cell groups of an adult human (left column) without magnetization transfer, (middle column) with magnetization transfer, and (right column) magnetization-transfer ratio map (scale: 34–53%). (b) (Left) Coronal MRI (spoiled 3D FLASH, TR/TE = 30/7.6 ms, flip angle 22°, Δf = 2500 Hz, ωSAT = 523°/12 ms, 117 µm isotropic resolution) of the locus coeruleus of a 4-week-old female mouse in comparison with (right column) corresponding Nissl-stained sections (adapted from50). (c) Coronal MRI sections of the A2 cell groups of a 4-week-old female wild-type mouse.

