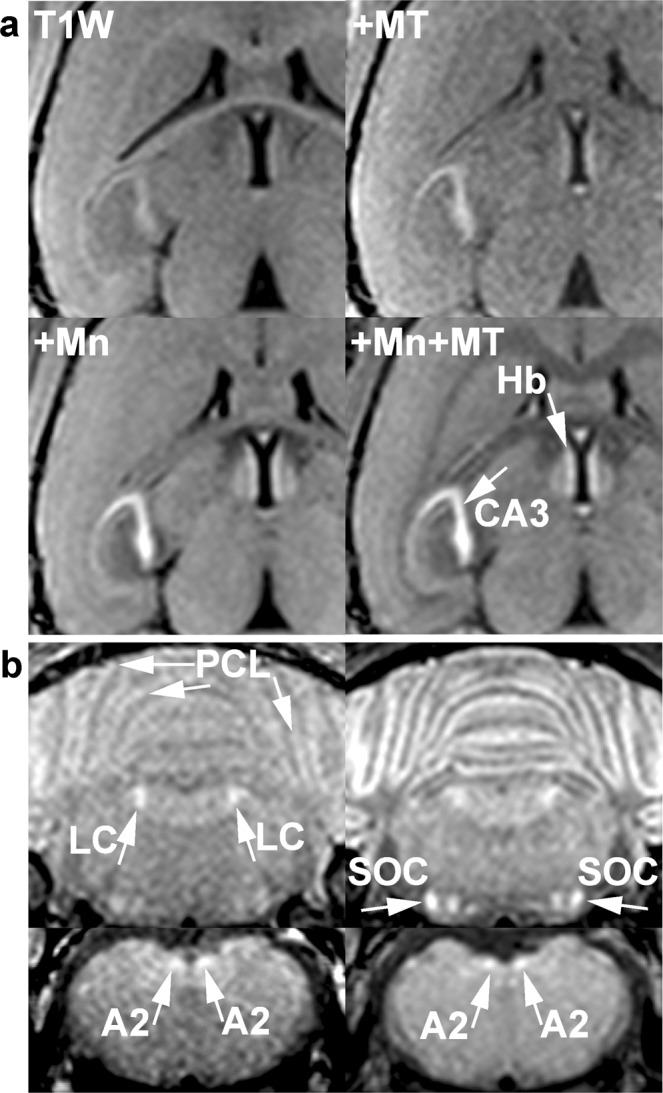
Figure 8.

(a) (T1W) Horizontal T1-weighted images of the brain of a female young adult NMRI mouse, (+MT) with magnetization transfer, (+Mn) after Mn2+ injection, and (+MT + Mn) with MT after Mn2+ injection. Magnetization transfer delineates nerve cell assemblies that are further enhanced by the accumulation of intracellular Mn2+. (b) (Top row) Coronal MRI of the locus coeruleus and (bottom row) A2 cell groups of the same mouse (left) before and (right) after Mn2+ injection. The effect of Mn2+ on noradrenergic neurons is less pronounced than that on other nerve cell assemblies such as the cerebellar Purkinje cell layers or the superior olivary complexes. A2 = noradrenergic cell group 2, Hb = habenular nucleus, CA3 = CA3 of the hippocampal formation, LC = locus coeruleus, PCL = Purkinje cell layer of the cerebellum, SOC = superior olivary complex.
