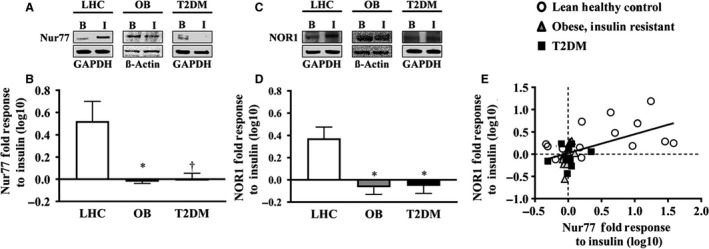
Figure 1.

Skeletal muscle Nur77 and NOR1 protein expression. (A) Representative Western blot image for Nur77. (B) Nur77 is robustly induced by insulin stimulation in LHC, whereas this effect is blunted in OB and T2DM. (C) Representative Western blot image of NOR1. (D) NOR1 is robustly induced by insulin stimulation in LHC, whereas this effect is blunted in OB and T2DM. (E) Correlation between Nur77 and NOR1 protein response to insulin. LHC, lean healthy control subjects; OB, obese individuals with insulin resistance; T2DM, individuals with type 2 diabetes mellitus; B, Basal, t = 0 min; I, Hyperinsulinemia, t = 120 min. *, significant difference from LHC; one‐way ANOVA with Bonferroni post hoc P < 0.01; †, significant difference from LHC; one‐way ANOVA with Bonferroni post hoc P < 0.05. Data presented has been log10 transformed for normality.
