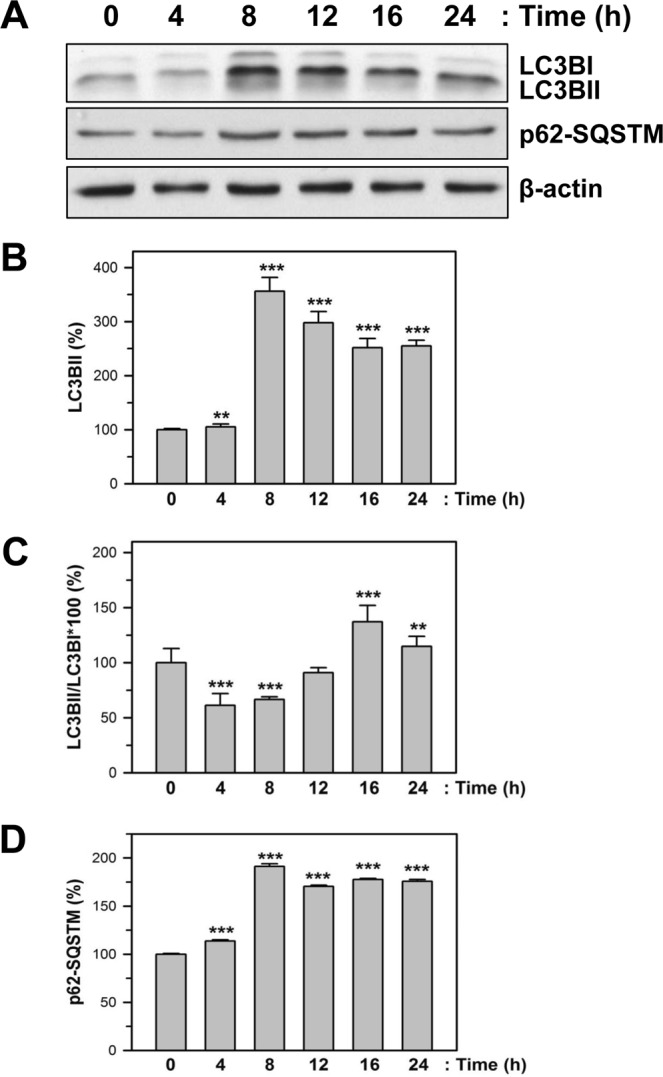
Figure 5.

Effect of CFZ on autophagy markers in SK-N-BE(2)-M17 cells. (A) SK-N-BE(2)-M17 cells were treated with 200 nM CFZ for the indicated times. Total cell extracts were analyzed by SDS-PAGE and western blot with antibodies against autophagy marker proteins, such as LC3BI/II, p62-SQSTM, and β-actin. (B–D) The band density was analyzed by densitometry of each band and plotted as the relative level (%) of LC3BII (B) and p62-SQSTM (D), the ratio of LC3BII/LC3BI (C). **P < 0.01 and ***P < 0.001, compared to the vehicle-treated control.
