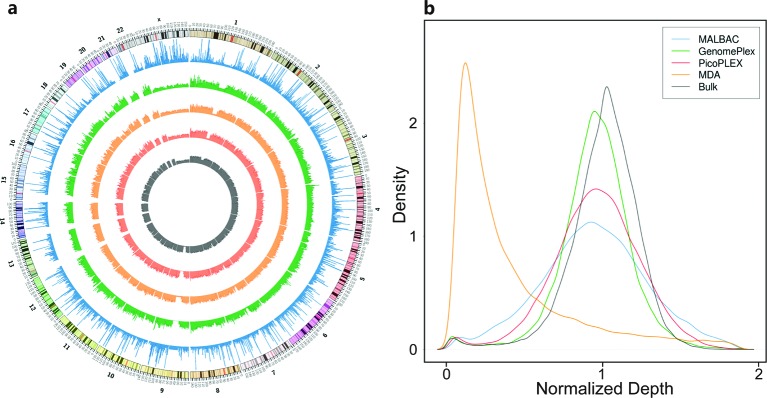
Figure 4. Uniformity of read depth across the whole genome.
(a) Read depth distribution across the whole genome. The five circles from inside to outside are normalized read depth in 100 kb windows of the bulk data (black), GenomePlex (light red), PicoPLEX (orange), MALBAC (green), and MDA (blue). The circle outside them is the chromosomal coordinate in a pter-qter orientation, which is zoomed out by 1,000,000 times, i.e. the actual position is the number on the circle multiplying 1 Mbp. (b) The Kernal density plots of normalized read depth in 100 kb windows of the four WGA kits and the bulk data.

