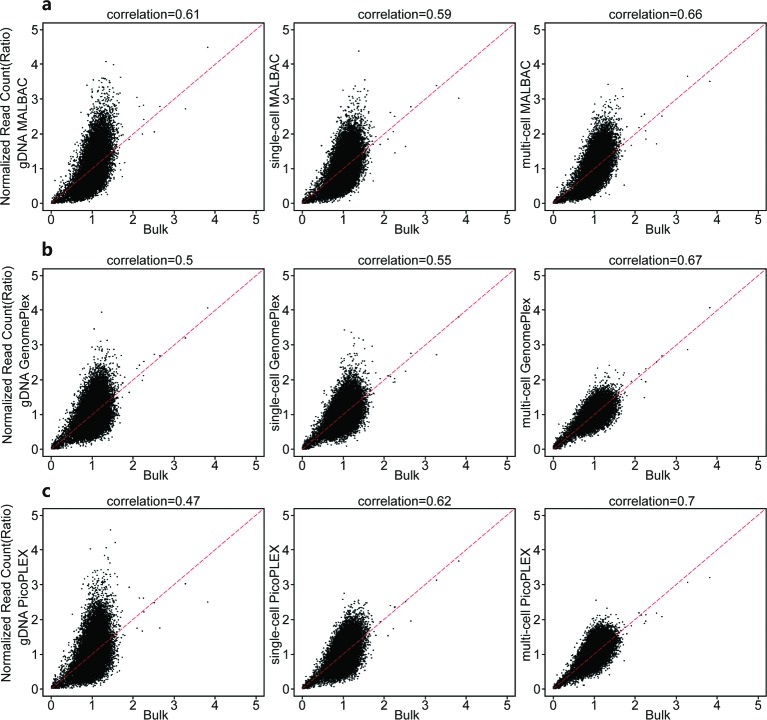
Figure 7. Amplification bias of WGA kits in different types of samples.
The normalized read count of WGA products of (a) MALBAC, (b) GenomePlex, and (c) PicoPLEX in different sample types is plotted against that of the unamplified sample. From left to right are plots of gDNA samples, single-cell samples, and multi-cell samples respectively.

