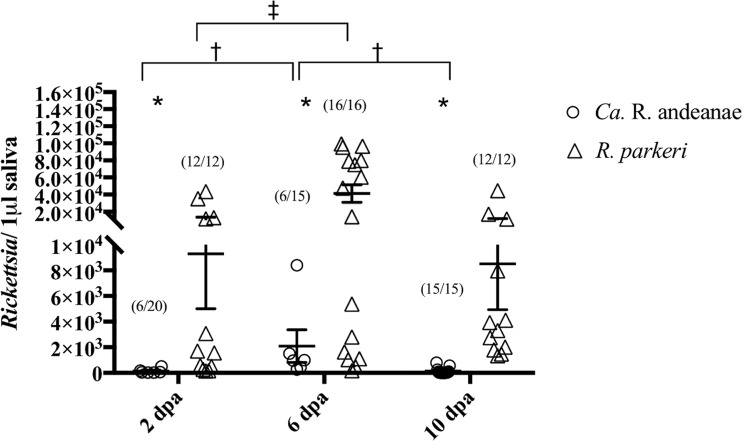
FIG 1.
Quantity of rickettsiae in A. maculatum saliva as assessed by qPCR. The quantity of rickettsiae is expressed per microliter of tick saliva at 2, 6, and 10 days postattachment (dpa). Statistical analysis consisted of nonparametric tests, used to test for differences in the medians between and among groups, and a Kruskal-Wallis test followed by Dunn’s post hoc analysis for differences among days within each Rickettsia species, with a P value of ≤0.05. Wide horizontal bars represent the means; error bars represent the standard errors of the means. Symbols indicate significant differences between species (*) or between time points for “Ca. Rickettsia andeanae” (†) or R. parkeri (‡).

