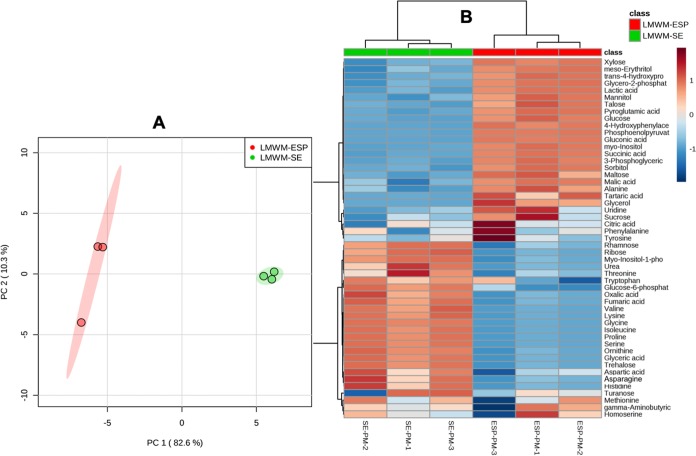
FIG 10.
Multivariate analysis of the sample groups containing polar metabolites of A. caninum. (A) PCA score plot showing clear separation of two groups, LMWM-SE and LMWM-ESP. (B) Heat map showing unsupervised hierarchical clustering of polar metabolites present in LMWM-SE (SE-PM, somatic extract polar metabolites) and the LMWM-ESP (ESP-PM, excretory-secretory products polar metabolites) (n = 3 biological replicates; distance measured using Euclidean algorithm and clustering using ward.D algorithm). Data were analyzed by MetaboAnalyst 4 (samples normalized by median, log transformation, and autoscaling).

