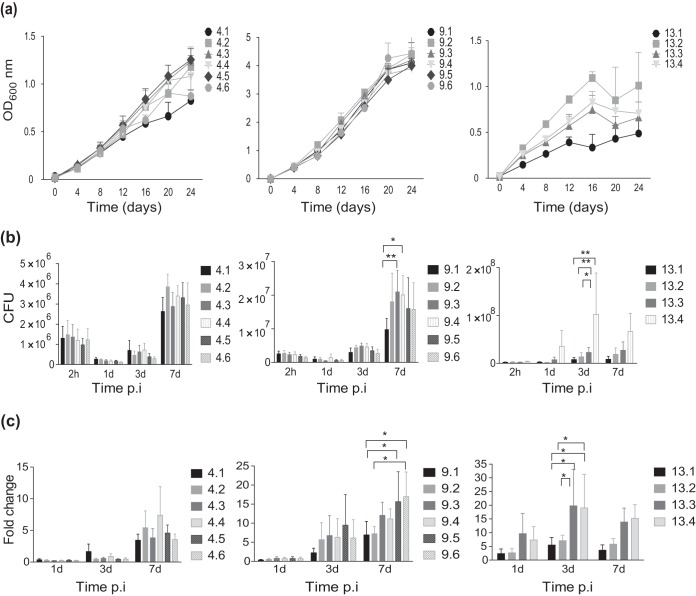
FIG 3.
Growth in broth and intracellular replication in macrophages of sequential M. avium isolates. (a) The growth curves of sequential M. avium isolates from patients 4, 9, and 13 grown for a period of 24 days were recorded. Isolates are numbered chronologically from the time that they were collected from the patients. Recordings were performed in triplicate; the OD values show the mean ± SEM. (b) Intracellular replication in murine BMDMs infected with isolates from patients 4, 9, and 13 at an MOI of 10. CFU counts from lysed macrophages were determined at 1, 3, and 7 days after infection. (c) Intracellular bacterial counts represented as the fold change normalized to the uptake of bacteria at 2 h postexposure/postinfection. Bars represent the mean ± SEM from four independent experiments. P values were determined by repeated-measures two-way ANOVA with the Tukey posttest. *, P < 0.05; **, P < 0.01.

