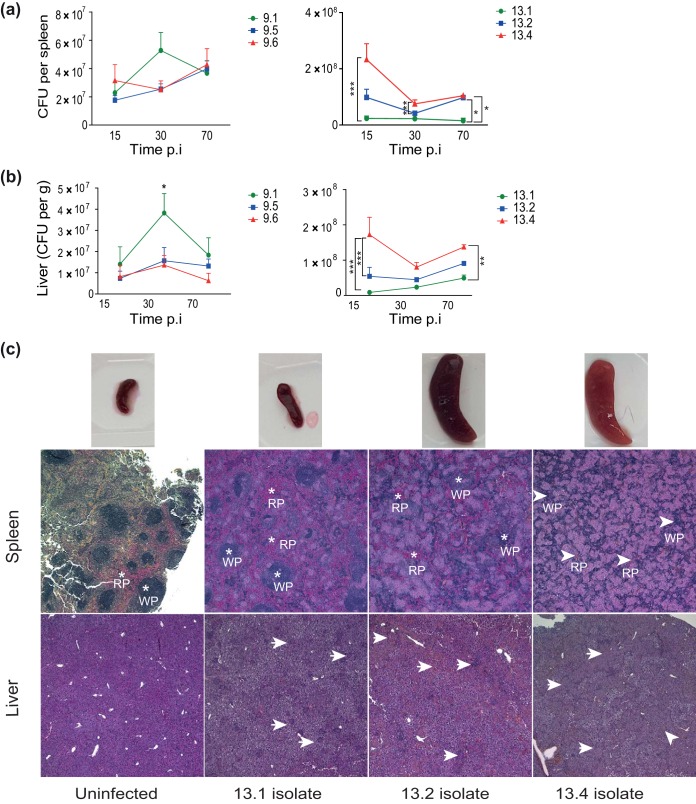
FIG 5.
Mycobacterial load and tissue pathology in mice infected with sequential M. avium clinical isolates. (a and b) C57BL/6 mice were infected intraperitoneally with M. avium isolates from patient 9 (isolates 9.1, 9.5, and 9.6) and patient 13 (isolates 13.1, 13.2, and 13.4) for 15, 30, and 70 days. Bacterial loads in spleen and liver tissue are shown as the mean number of CFU per spleen ± SEM and the number of CFU per gram ± SEM for liver from two experiments with four mice in each group, respectively. P values were determined by repeated-measures two-way ANOVA and Bonferroni’s posttest. *, P < 0.05; **, P < 0.01; ***, P < 0.001. (c) Histological examination of spleen and liver from mice infected with M. avium isolates 13.1, 13.2, and 13.4 at day 70 postinfection. (Top) Spleens; (middle) spleen tissue histology sections (RP, red pulp areas; WP, white pulp areas); (bottom) liver histology. Arrowheads point to granulomatous structures. Images were taken at ×40 magnification. Experiments were done twice with similar results each time; the findings from one representative experiment are shown.

