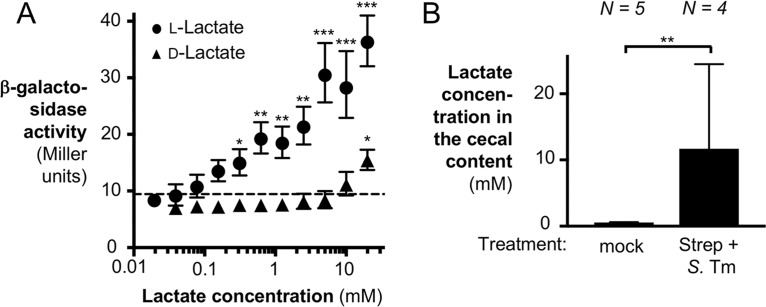
FIG 3.
Analysis of lldPRD transcription in response to various concentrations of l-lactate and d-lactate. (A) The lldD-lacZ transcriptional reporter strain CG254 (lldD::pCG254) was grown in LB for 135 min in the presence of 1% oxygen with various concentrations of l-lactate or d-lactate. lldD transcription was assessed by determination of β-galactosidase activity. The dashed line indicates the β-galactosidase activity in the absence of lactate. All experiments were conducted with at least 3 biological replicates. Note that in some instances, the size of the error bar is smaller than the symbol representing the geometric mean. (B) C57BL/6 mice were treated intragastrically with streptomycin, followed by infection with the S. Typhimurium ΔlldD mutant (CG6) 1 day later (Strep + S. Tm). Mock-treated mice (mock) received water, followed by LB 1 day later. The cecal content was collected 5 days after infection for lactate quantification by GC-MS. To determine differences between groups, a two-tailed, unpaired Student's t test on ln-transformed data was used. Bars and symbols indicate the geometric mean ± standard error. *, P < 0.05; **, P < 0.01; ***, P < 0.001.

