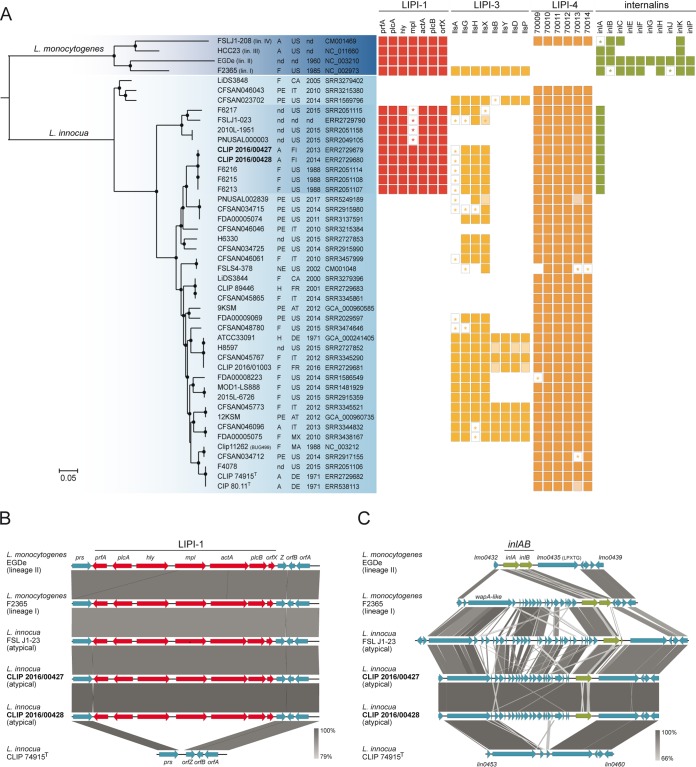
FIG 1.
Phylogenetic and comparative genomic analyses. (A) Rooted maximum likelihood phylogeny of 42 L. innocua genomes based on 642,408 core genome SNPs. Representative genomes of the four L. monocytogenes lineages were used as the outgroup. Circles represent bootstrap branch support values higher than 90% based on 1,000 replicates. Information on the source (A, animal; F, food; H, human; PE, production environment; NE, natural environment; nd, unknown), country, and year of isolation, as well as the NCBI/EMBL/DDBJ accession numbers, is provided in the columns. Colored boxes represent the presence of the different genetic traits. Light-colored boxes represent genes interrupted by end of contigs. Stars represent truncated genes due to the presence of internal stop codons. (B and C) Organization of the LIPI-1 and inlAB loci and their flanking regions. Arrows denote the orientation of genes. Gray blocks denote BLASTN similarities between sequences.

