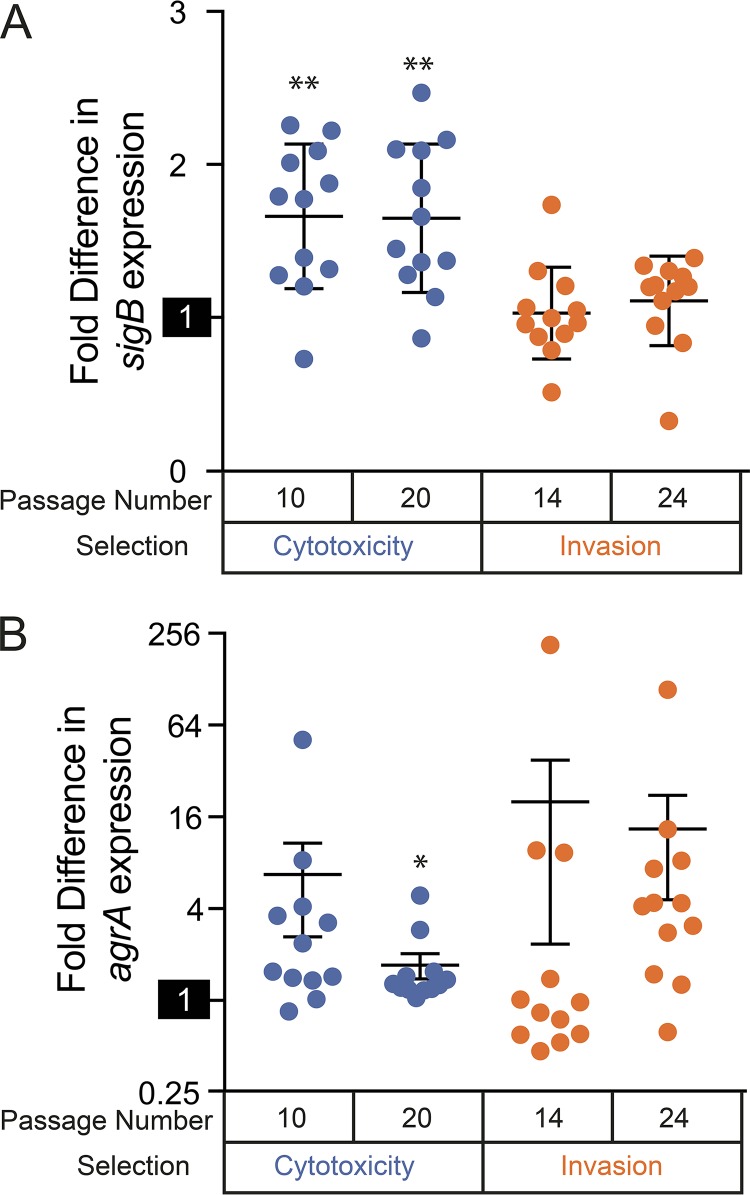
FIG 3.
Expression of sigB and agrA in evolved S. aureus isolates. Real-time PCR quantitation of sigB (A) and agrA (B) was normalized to the parental strain, with isolates aggregated by selection type and time of passaging. The reference activity of the wild-type strain (set to 1) is highlighted on each y axis. The data points correspond to individual strains, the horizontal lines indicate medians for aggregated groups of strains, and the error bars indicate SEM for the groups. Note the log2 scale in panel B. Populations that are significantly different (Z test) from the parental strain are indicated by asterisks: *, P < 0.05; **, P < 0.001.

