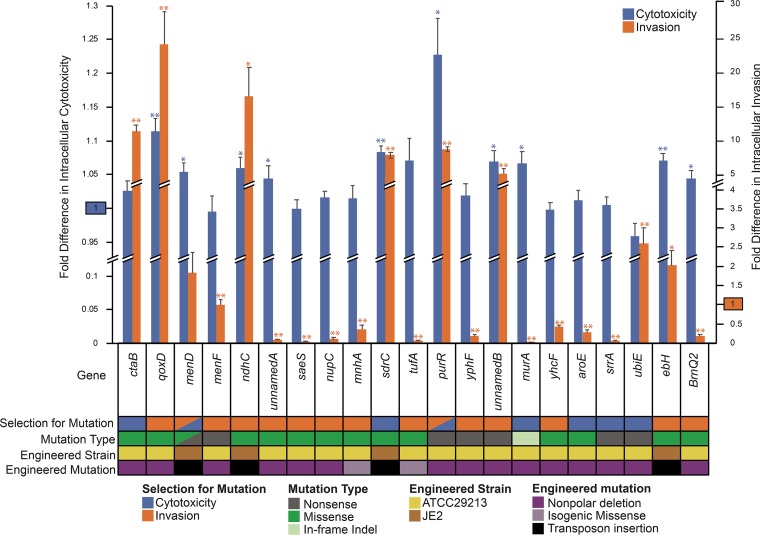
FIG 4.
Virulence phenotypes of single-gene mutant strains. Intracellular cytotoxicity (left axis) and intracellular invasion (right axis) activities of single-gene mutants relative to the parental strain are displayed. The reference activity of the parental strain (set to 1) is highlighted separately on each y axis. Measured values that are significantly different (by 2-tailed t test) than those of the parental strain are indicated by asterisks: *, P < 0.03; **, P < 0.001. The asterisks are colored to correspond to the phenotype being assessed. The error bars indicate SEM. Information about the selection conditions that identified specific gene mutations, the types of mutations identified, and the background and design of engineered mutant strains is color coded beneath the chart.

