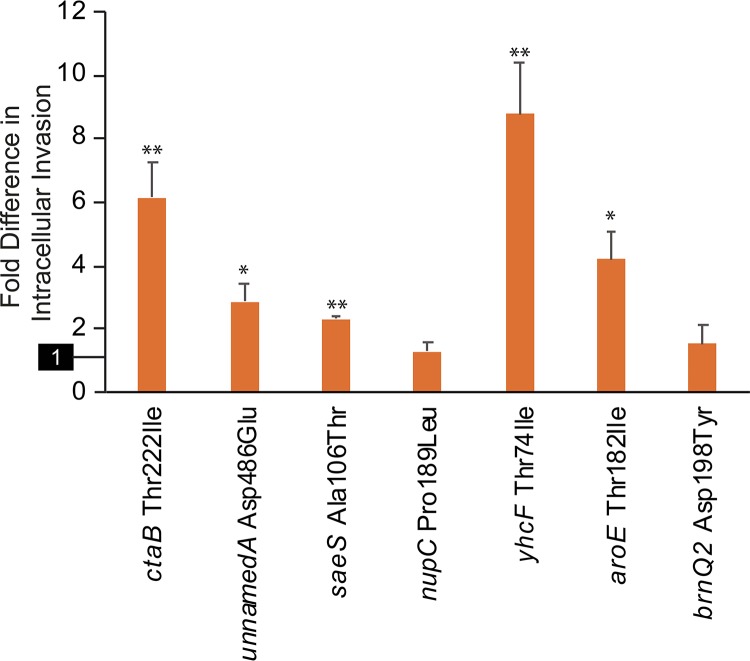
FIG 5.
Invasiveness of complemented mutant strains. Shown are intracellular invasion activities of single-gene deletion strains complemented with the specified mutant genes relative to the values seen for the same strains complemented with wild-type genes. The reference activity of the wild-type-complemented strain (set to 1) is highlighted on the y axis. The error bars indicate SEM. Measured values that are significantly different (by 2-tailed t test) than those of the wild-type-complemented strain are indicated by asterisks: *, P < 0.04; **, P < 0.001.

