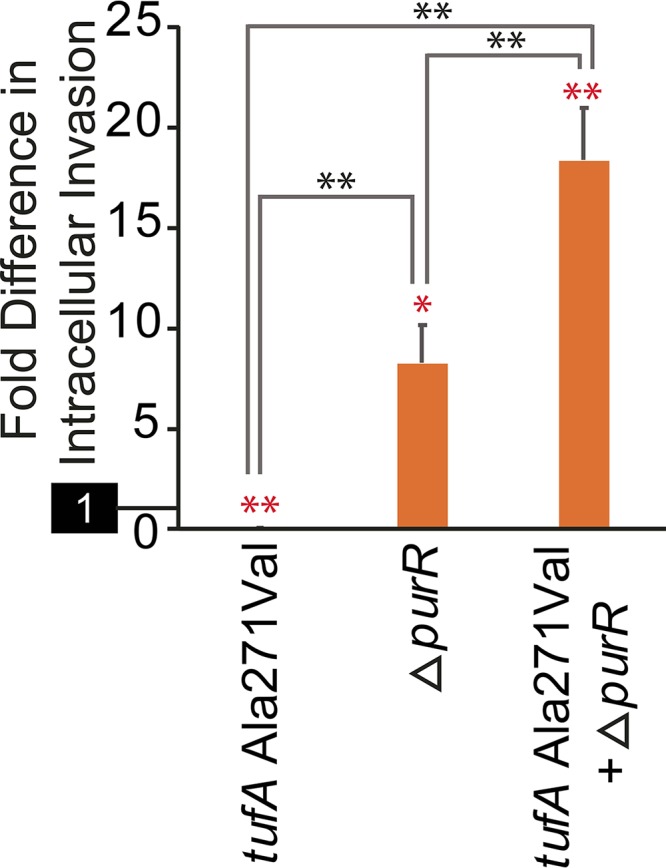
FIG 6.

Epistatic interactions influence virulence phenotypes. Intracellular invasion of single- and double- mutant strains of ATCC 29213 relative to the parental strain are displayed. The reference activity of the wild-type parent (set to 1) is highlighted separately on the y axis. The error bars indicate SEM. The statistical significance of comparisons is shown by asterisks: *, P < 0.03; **, P < 0.001 (2-tailed t test). The red asterisks indicate statistical comparison to the parental strain; the black asterisks correspond to comparisons between different mutant strains.
