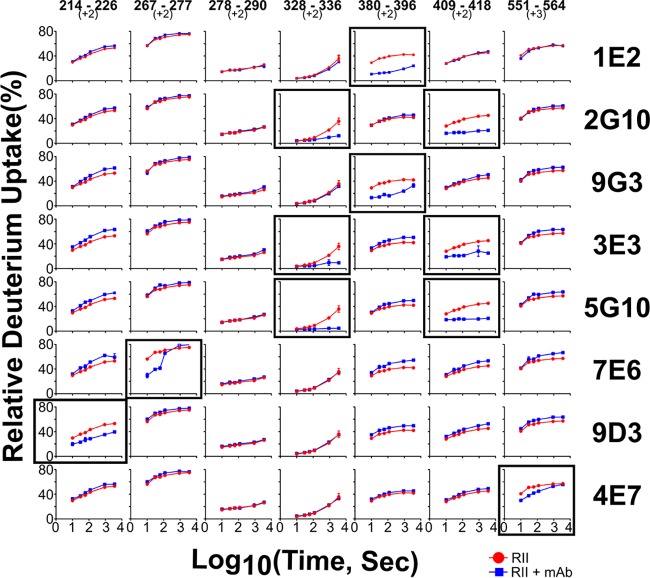
FIG 5.
HDX uptake plots for different regions of PfEBA-140. The kinetic plots for seven peptides from PfEBA-140 in the presence of various MAbs (PfEBA-140 plus MAbs, depicted in blue) and in the absence of the MAb (PfEBA-140 alone, depicted in red). Each region (column) is represented by a peptic peptide and its charge state, as measured by mass spectrometry. Each row represents a state bound with a MAb; the antibody is listed on the right. Those regions showing reduced rates or extents of exchange for the sample of PfEBA-140 with MAbs (blue) are considered to contain the epitopes. Those regions with no difference are examples of regions that do not contain the epitopes and can be viewed as controls. Boxed plots are those that showed a difference upon addition of antibody for each MAb tested.

