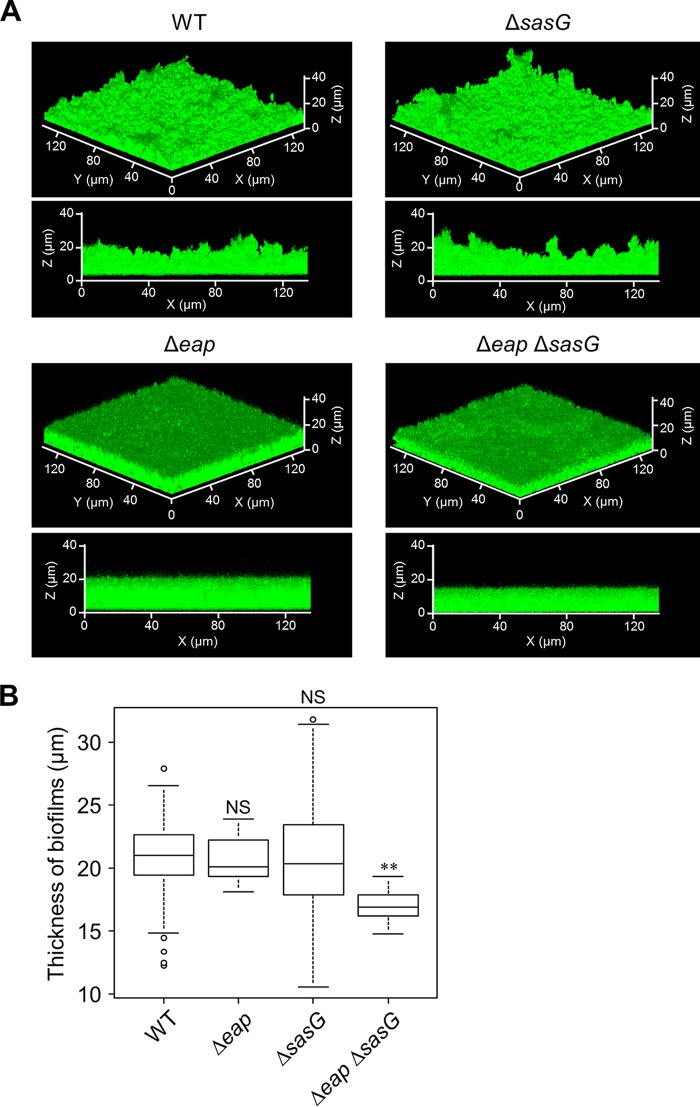
FIG 5.
Three-dimensional structure of bacterial biofilms. (A) Biofilms formed by the indicated strains were stained with thioflavin T and analyzed using CLSM. Typical top oblique and side views of the biofilms are shown. (B) Thicknesses of the biofilms formed in three independent dishes were determined using ImageJ software. The line in each box-and-whisker plot represents the median thickness of biofilms formed by the indicated strains. O, outlying values; **, P < 0.01; NS, not significant.

