
Figure 2.
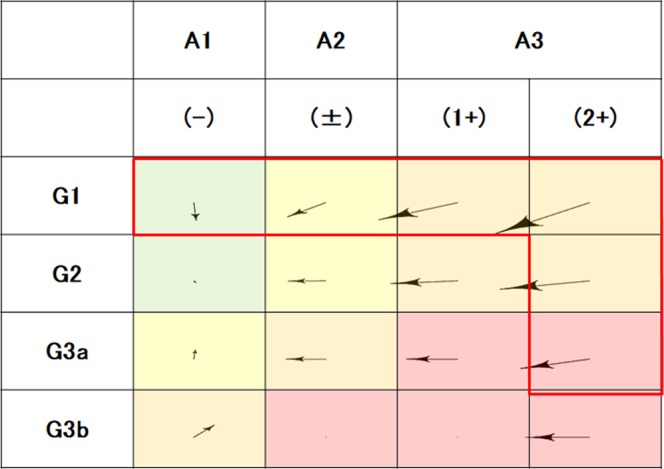
Mean changes in CKD stages of subjects from 2009 to 2016. G1 to G3b and (−) to (2+) are GFR categories of CKD stages and proteinuria grades, respectively. Colors of cells mean low (green), moderately increased (yellow), high (orange), and very high risks (red) as the KDIGO prognostic categories of CKD. Arrows show the mean direction of changes in CKD stages of participants from 2009 to 2016. A red line surrounds CKD stages with high risks. Abbreviations: CKD, chronic kidney disease; GFR, glomerular filtration rate.