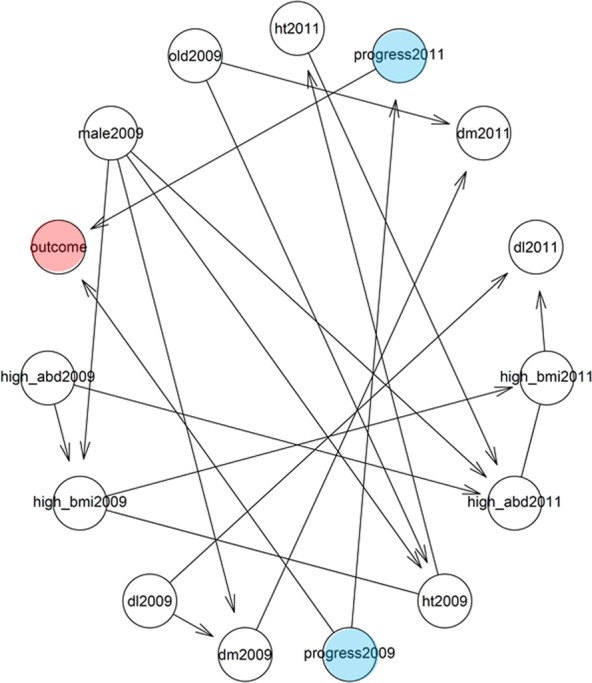
Figure 3.

Bayesian network constructed using the data in 2011. Arrows show the causal relationships between variables. Abbreviations: Outcome, the progression of the prognostic category of CKD or very high risk in 2016; progress2009, the prognostic category of CKD in 2009; ht2009, hypertension in 2009; dm2009, diabetes mellitus in 2009; dl2009, dyslipidemia in 2009; old2009, age of 46 years or more in 2009; high_BMI, body mass index of 22.8 kg/m2 or more in 2009; high_abd, waist circumference of 81.4 cm or more in 2009.
