Figure 2.
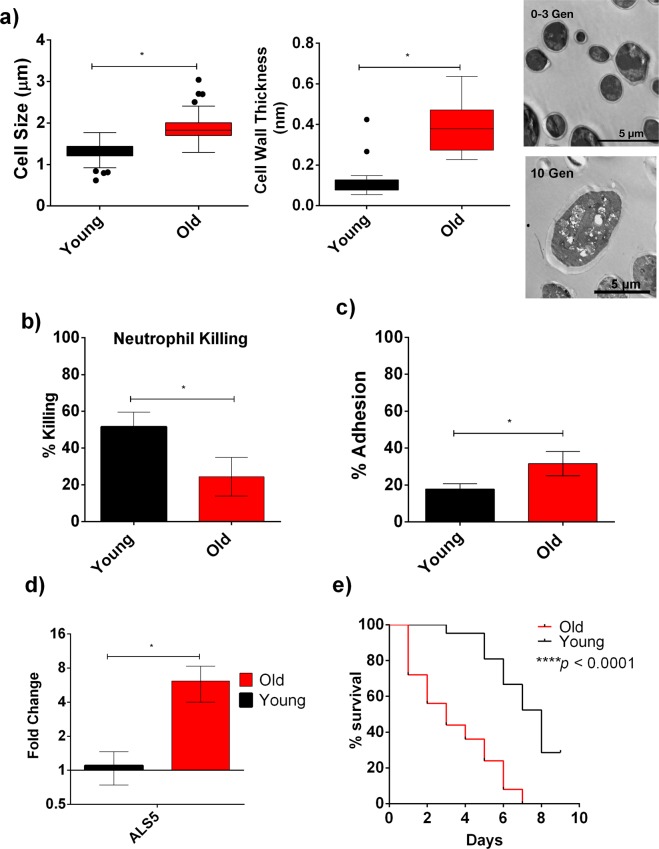
Increased Virulence of 10 Gen Old C. auris Cells from FLC- Susceptible S1: (a) Cell size and Cell wall thickness of the old (10 Gen) cells were significantly greater compared to young (0–3 Gen) cells. Cell wall thickness (n = 23) and Cell Size (n = 150) were measured by ImageJ software from the microscopic images of individual young and old cells. Student’s t-test was performed to analyze the significance (*p < 0.001). Transmission Electron Microscopic (TEM) image of the old (10 Gen) cells of C. auris showing increased cell wall thickness compared to the young (0–3 Gen) cells. (b) Percent Neutrophil-mediated Killing of young (0–3 Gen: black bar) and old (10 Gen: red bar) cells of C. auris. The assay was done in triplicate and error bars signify standard deviation. Student’s t-test with Welch’s correction was performed to determine the significance; *p = 0.0266. (c) Percent adhesion of young (0–3 Gen: black bar) and old (10 Gen: red bar) cells of C. auris. The assay was done in triplicate and error bars signify standard deviation. Student’s t-test with Welch’s correction was performed to determine the significance; *p = 0.0291. (d) qPCR analysis to study the expression of ALS5 in young and old cells. ACT1 gene was used as an internal control and the data was normalized to gene expression in young cells. The assay was done in triplicate and error bars signify standard deviation. Multiple t-test was performed using Holm-Sidak method to analyze the significance; *p = 0.016. (e) Virulence of young (0–3 Gen) and old (10 Gen) cells of C. auris in Galleria. 20 larvae were infected separately with 105 young and old cells. Log rank test was used to determine the statistical significance.

