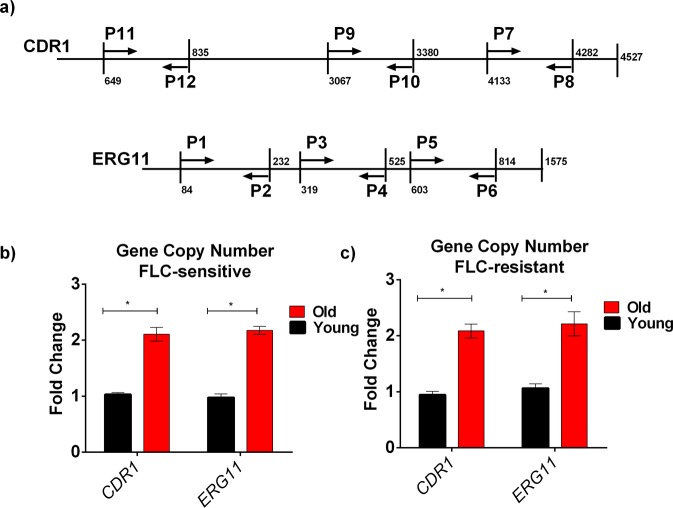
Figure 5.
qPCR Analysis to Study the Increase in Copy Numbers of CDR1 and ERG11 in Old C. auris cells isolated from strain S1.: (a) Cartoon showing the location of the oligonucleotides used in this analysis. The primers span 3 different regions of each genes. “P” denotes primer. All primers listed in Table S1. Genomic DNA was isolated from both old (10 generation) cells and young (0–3 generation) cells of FLC-sensitive strain S1 (b) and FLC-resistant strain S9 (c). Data shows the gene copy numbers of CDR1 and ERG11 using oligo sets P7-P8 (CDR1) and P5-P6 (ERG11) ACT1 was used as a control for the experiment and the data was normalized to the gene copy number of young cells. The assay was performed in triplicate and error bars signify standard deviation. Multiple t-test was performed using Holm-Sidak method to analyze the significance; *p < 0.05.

