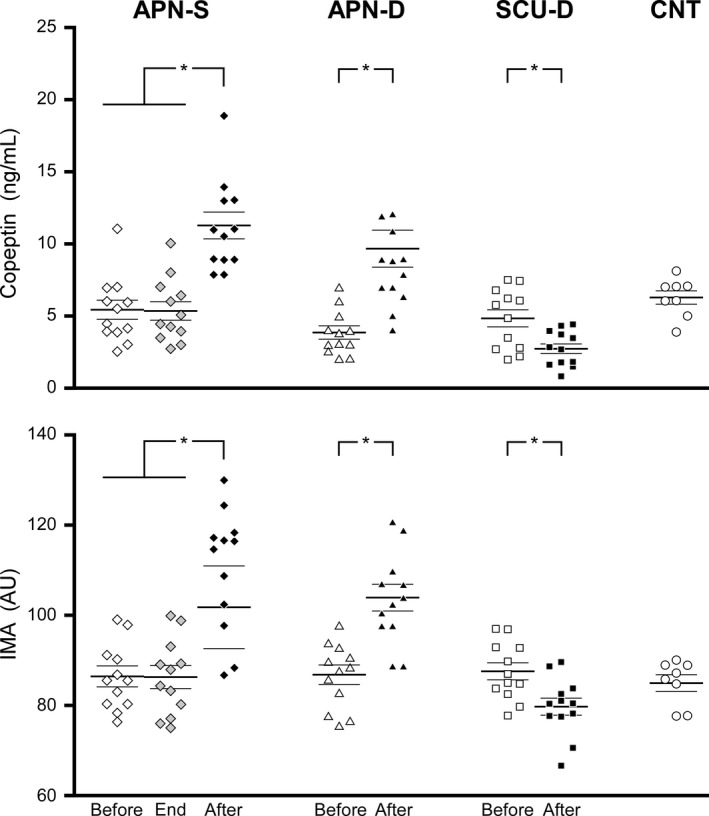
Figure 1.

Individuals and group (average – thick horizontal bar ± 1SD – thin horizontal bars) values of copeptin (upper panel) and IMA (lower panel) measured before (open symbols) and 10 min after (black symbol) dry static apneas (APN‐S), apneic dives (APN‐D), and SCUBA dives (SCU‐D). The APN‐S situation was the only one in which values could also be measured exactly at the end of the apnea (gray symbols). All basal values (before) were compared with the values at rest of a control group (CNT). *Indicates a significant difference at P < 0.05 between the values measured before and after the experimental situation.
