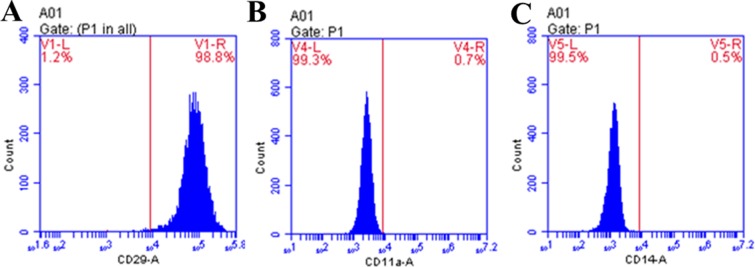
Figure 3. Flow cytometric analysis of the isolated hBMSC.
(A) CD29: right panel exhibits the percentage of positive CD29 present. Left panel indicates the percentage of negatively presented CD29.
(B) CD11a: right panel shows the percentage of positive presentation of CD11a present. Left panel demonstrates the percentage of negative CD11a present.
(C) CD14: right panel exhibits the percentage of positive CD14 present. Left panel indicates the percentage of negatively presented CD14. Results are representative of three independent experiments.

