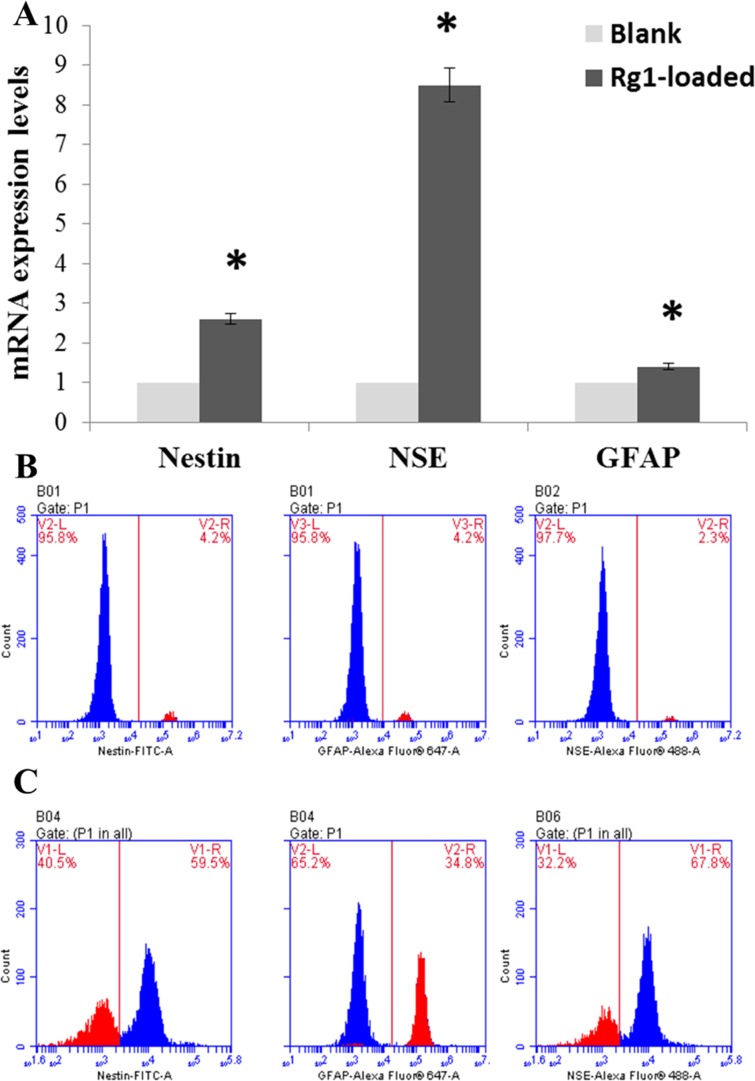
Figure 5. Relative mRNA expression levels of specific marker related genes in hBMSC and flow cytometric analysis of the differentiated hBMSC.
(A) Quantitative real-time PCR detected mRNA expression of nestin, NSE and GFAP. GAPDH was used as control. * indicates significant intergroup difference when compared with the blank microspheres group (*P<0.05).
(B) The percentages of differentiated hBMSC in blank microspheres group.
(C) The percentages of differentiated hBMSC in Rg1-loaded microspheres group.

