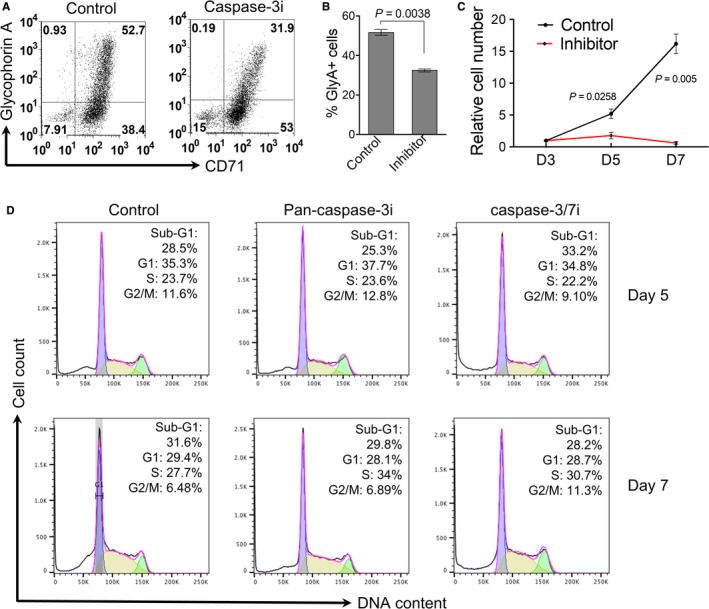
Figure 4.

Caspase‐3 inhibition leads to the blockage of human erythroid cells differentiation and proliferation. A, CD34+ cells cultured in Epo‐containing medium were treated with caspase‐3 inhibitor on day 3 in culture and collected on day 7. Flow cytometric analysis of transferrin receptor (CD71) and glycophorin A were performed. B, Quantitative analysis of the percentage of glycophorin A positive cells (GlyA+) in A. Data were obtained from three independent experiments. C, CD34+ cells cultured in Epo‐containing medium were treated with caspase‐3 inhibitor on day 3, and the total cell number was counted on indicated days in culture. Data were shown as fold changes (day 3 as 1) and obtained from three independent experiments. D, Flow cytometric analysis of cell cycle distribution. Cells were treated as in C and analyzed by flow cytometry using propidium iodide (PI)‐staining. The percentages of populations of different cell cycle phases are shown in the upper‐right corner. The data are representative of three independent experiments
