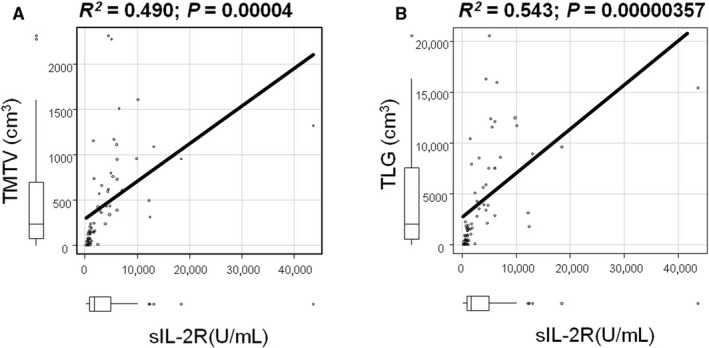
Figure 2.

Correlation of sIL‐2R level with TMTV. In the training population (n = 64), positive correlation between sIL‐2R and TMTV (Pearson R 2 = 0.490; P = 0.00004) (A) is shown. Positive correlation between sIL‐2R and TMTV (Pearson R 2 = 0.461; P = 0.00000631) (B) in the validation cohort (n = 86) is shown
