Figure 3.

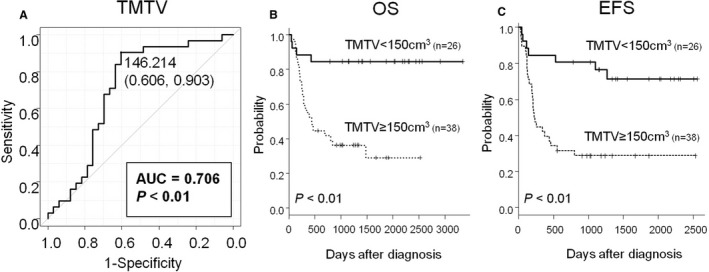
ROC according to TMTV. In the training cohort, with regarding failure in achievement of 2‐year EFS as positive finding, ROC according to TMTV (A) is shown. Kaplan‐Meier plots of OS (B) and EFS (C) according to TMTV is shown (n = 64)

ROC according to TMTV. In the training cohort, with regarding failure in achievement of 2‐year EFS as positive finding, ROC according to TMTV (A) is shown. Kaplan‐Meier plots of OS (B) and EFS (C) according to TMTV is shown (n = 64)