
Figure 1.
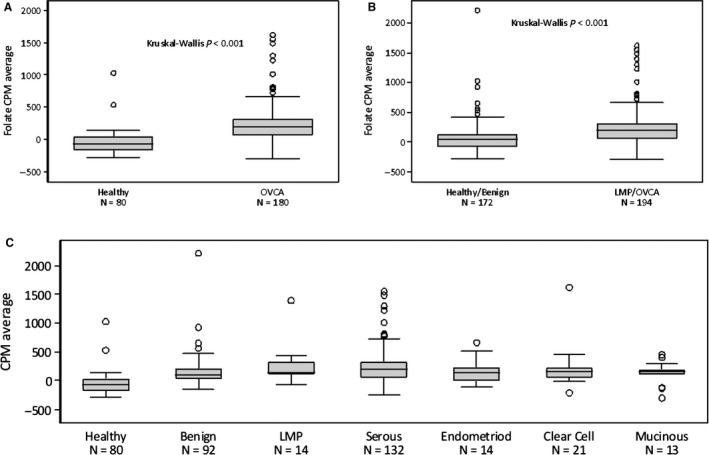
“Initial Diagnosis” Cohort: sFR levels. A, sFR levels for healthy women (n = 80) vs women with ovarian cancer/LMP (n = 194), using the Kruskal‐Wallis test. Healthy women differ from those with OVCA (P < 0.001). B, sFR levels for healthy women and those with benign disease (n = 172) compared to women with LMP tumors and ovarian cancer. Healthy/benign vs. OVCA results were significantly different (P < 0.001). C, sFR levels were broken down by tumor type for histologic subtype. Healthy patients are different from all subtypes of cancer, as well as benign (P < 0.001). Benign results are significantly different from those for HGSC (P < 0.0002) but not from other subtypes (given smaller n‐values)