
Figure 1.
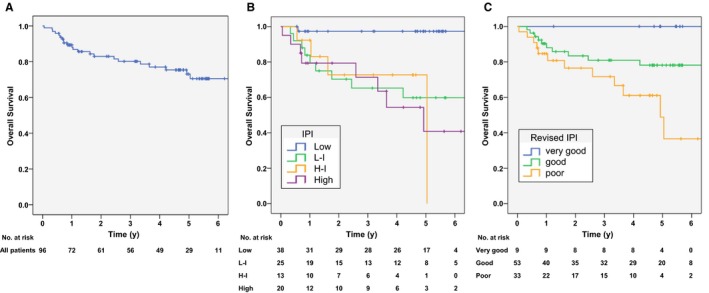
Overall survival (OS) curves according to International prognostic index (IPI), and revised IPI (R‐IPI). (A) OS in total patients. 3‐ and 5‐year OS rates were 80% and 73%, respectively. (B) OS curves according to IPI. The 5‐year OS rates were 97%, 60%, 73%, and 41% in low, low‐intermediate, high‐intermediate, and high‐risk groups, respectively (P < 0.001). (C) OS curves according to R‐IPI. The 3‐ and 5‐year OS rates were 100% and 100% in the “very good” category, 81% and 78% in the “good” category, and 72% and 49% in the “poor” category, respectively (P = 0.013)