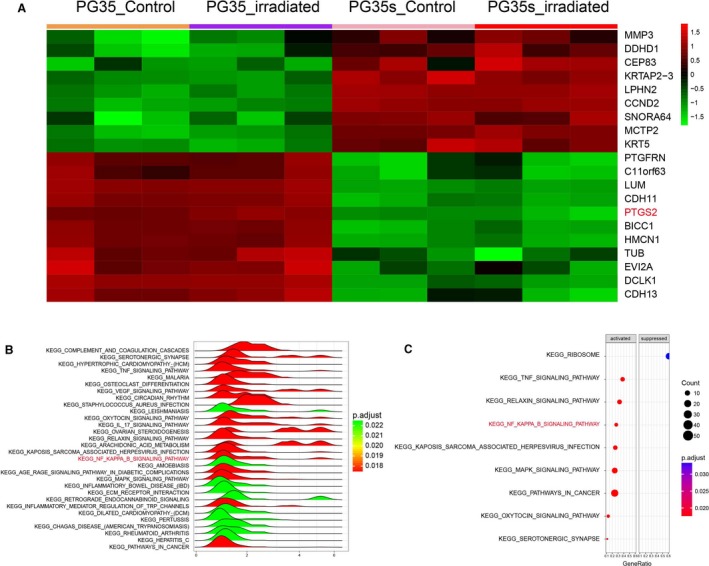
Figure 1.

Bioinformatics analysis of glioma radiotherapy tolerance. A, Hierarchical cluster analysis of the upregulated and downregulated mRNAs. In the heat map, green color represents downregulation whereas red represents upregulation. B and C, Joyplot and dotplot results of the dysregulated KEGG pathways in glioma. In the ridge plot (B), the color was applied according to the adjusted p value. Every ridge represents a pathway. When a ridge was on the right side of 0, the pathway was activated in glioma. In the dotplot (C), activated and suppressed columns mean activated and suppressed in glioma. P.adjust: adjusted P value
