
Figure 2.
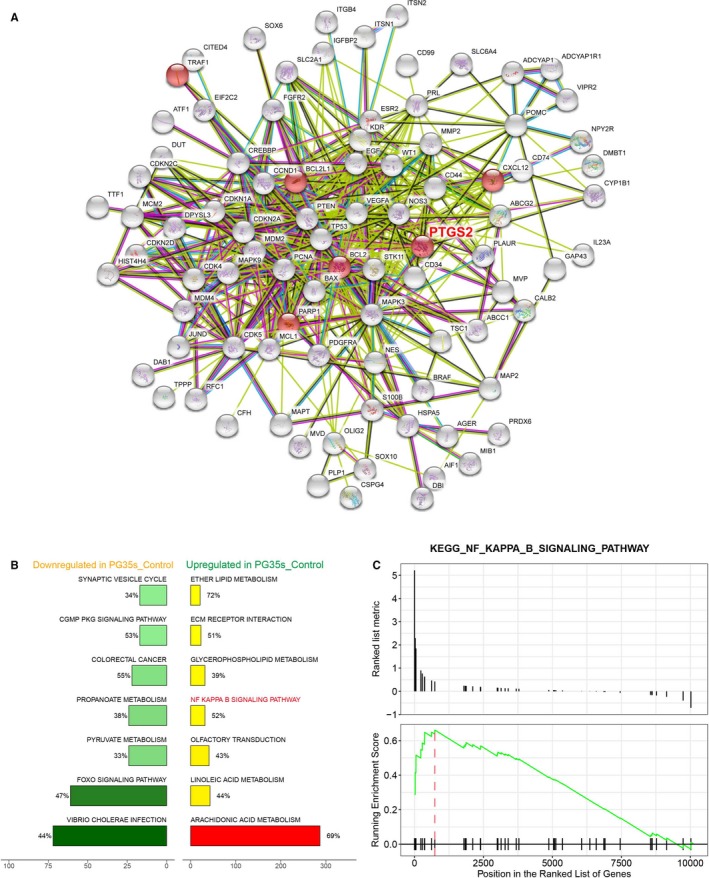
Bioinformatics analysis of NF‐κB signaling pathway. A, Protein‐protein interaction networks of differentially expressed genes in glioma. This network was obtained from STRING analysis. PTGS2 was seen interacted with a plenty of proteins. B, A plot of seven most enriched KEGG pathways in PG35s. Pathways were ordered by normalized enrichment score (NES). Percentage beside the bar indicated the proportion of differential genes in pathway gene set. The x‐axis stands for the number of genes in a pathway. C, Gseaplot showed that most genes of NF‐κB signaling pathway were overexpressed in PG35s