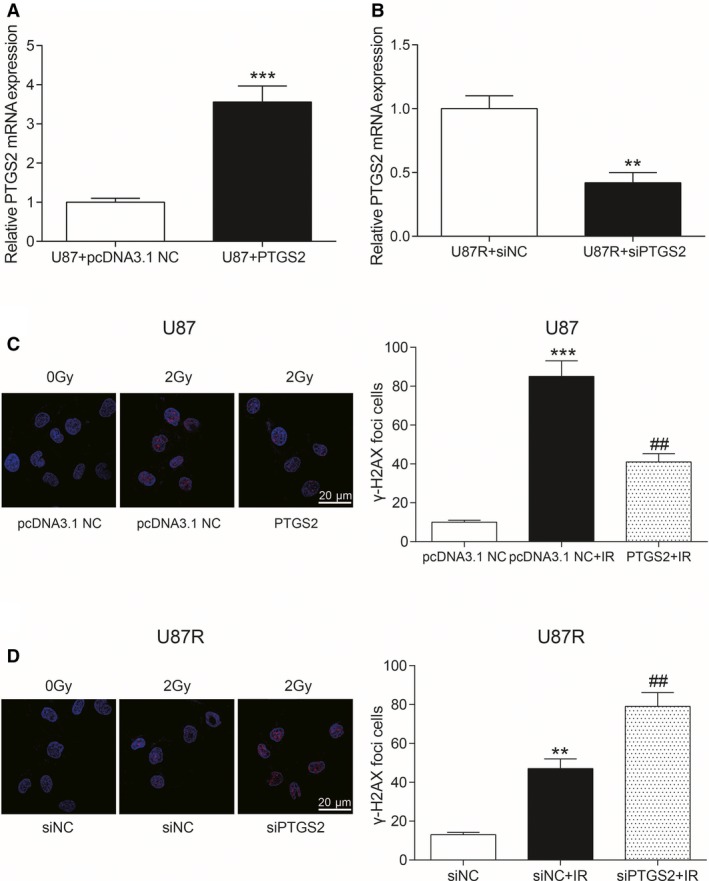
Figure 4.

Effects of PTGS2 on radiotherapy. A, The expression of PTGS2 mRNA in U87 cells transfected with PTGS2 overexpression plasmids and control group. ***P < 0.001, compared with U87 + pcDNA3.1 NC group. B, The expression of PTGS2 mRNA in U87R cells transfected with siPTGS2 and the control group. **P < 0.01, compared with U87R + siNC group. C, Immunofluorescence was used to determine the content of γ‐H2AX in U87 cells. Scale bar: 20 μm. Red dots were γ‐H2AX. ***P < 0.001, compared with pcDNA3.1 NC group. ##P < 0.01, compared with pcDNA3. 1 NC + IR group. D, Immunofluorescence was used to determine the content of γ‐H2AX in U87R cells. Scale bar: 20 μm. Red dots were γ‐H2AX. **P < 0.01, compared with siNC group. ##P < 0.01, compared with siNC + IR group
