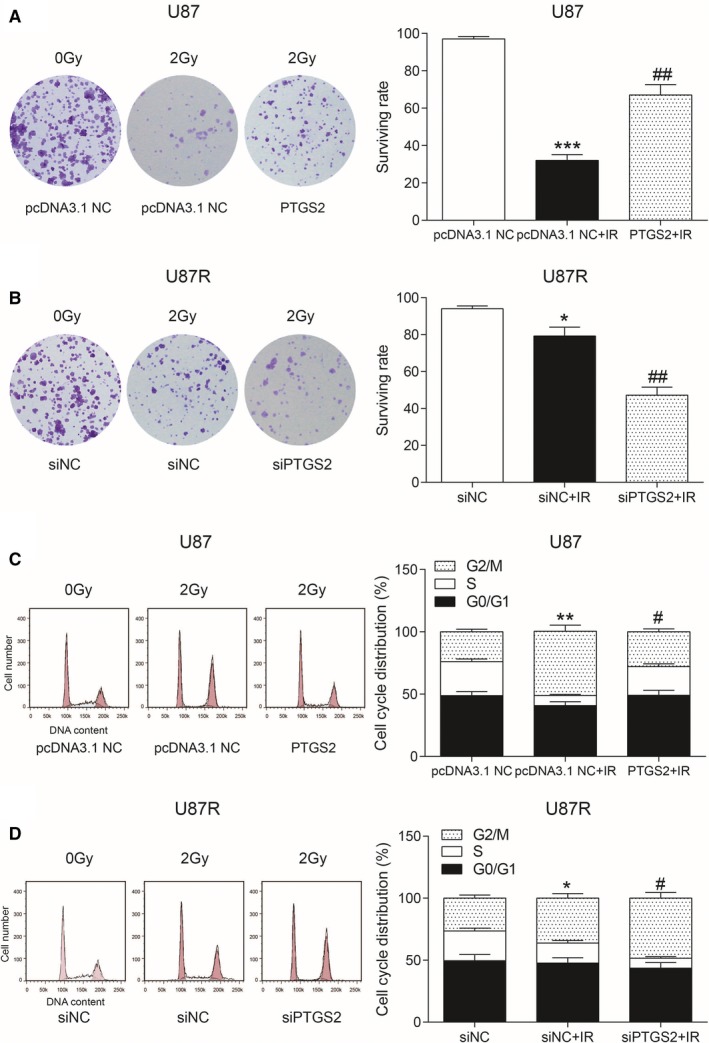
Figure 5.

Effects of PTGS2 on radioresistance and cell cycle. A, The survival rate of U87 cells was detected by clone survival assay. ***P < 0.001, compared with pcDNA3.1 NC group. ##P < 0.01, compared with pcDNA3. NC + IR group. B, The survival rate of U87R cells was detected by clone survival assay. *P < 0.05, compared with siNC group. ##P < 0.01, compared with siNC + IR group. C, Flow cytometry was used to detect U87 cell cycle. **P < 0.01, compared with pcDNA3.1 NC group. #P < 0.05, compared with pcDNA3.1 NC + IR group. D, Flow cytometry was used to detect U87R cell cycle. *P < 0.05, compared with siNC group. #P < 0.05, compared with siNC + IR group
