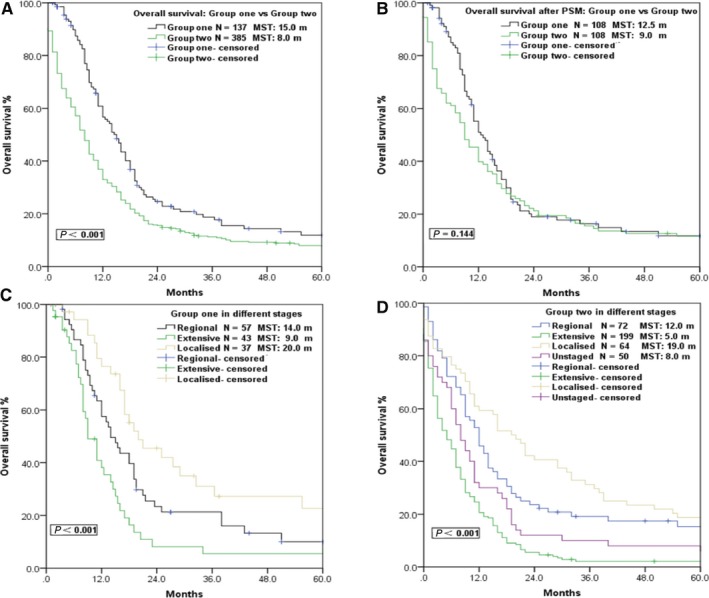
Figure 1.

Survival curves of patients in different groups and different VALSG stages. (A) Survival curve comparison between Group ONE and Group TWO. (B) After propensity score matching (PSM), the overall survival differences between 108 patients in Group ONE and those in Group TWO disappeared. (C) Survival curves of different VALSG stages in Group ONE. (D) Survival curves of different VALSG stages in Group TWO
