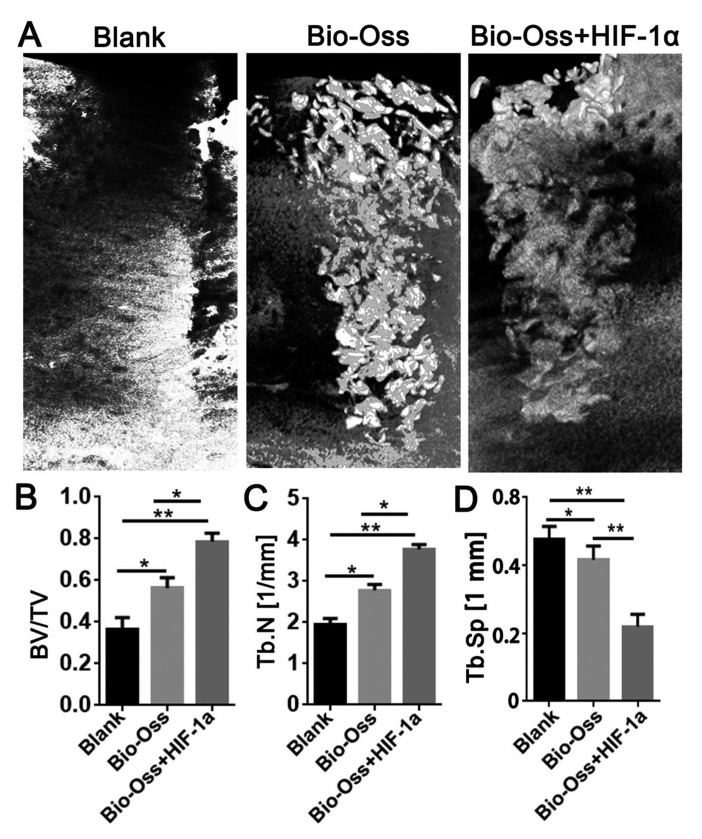
Figure 2.
Micro-CT examination of the extraction sockets in the three groups 12 weeks post-surgery. (A) Three-dimensional reconstruction of the extraction sockets in Blank group, Bio-Oss group and Bio-Oss + HIF-1α group. (B) BV/TV. (C) Tb.N. (D) Tb.Sp. Data were presented as mean ± standard deviation, n>3. *P<0.05 and **P<0.01 as indicated. BV/TV, bone volume/tissue volume; Tb.N, trabecular number; Tb.Sp, trabecular separation; HIF-1α, hypoxia-inducible factor-1α.

