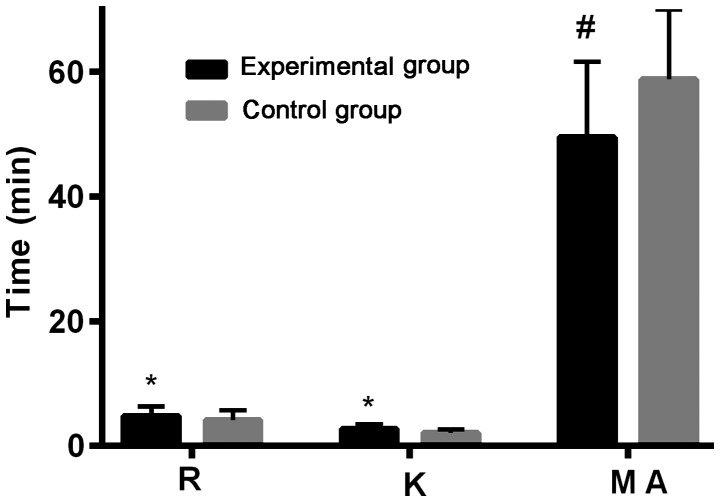
Figure 1.
Comparison of postoperative TEG detection of coagulation function of patients between two groups. Patients in the experimental group had higher R (coagulation reaction time) value and K (blood clot formation time) value than those in the control group after treatment (*P<0.05), and lower MA (maximum amplitude) value than those in the control group (#P<0.01).

