
Figure 1.
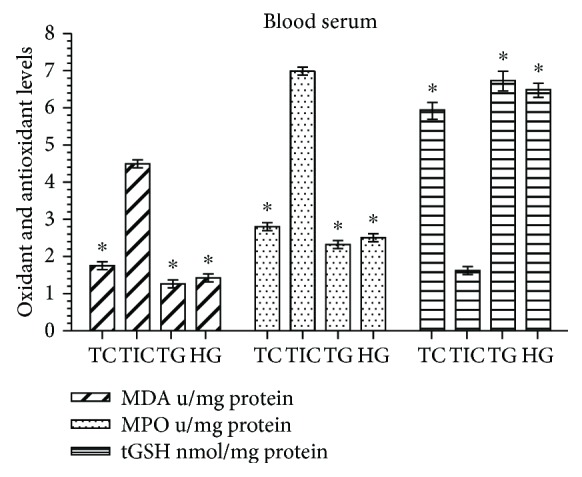
MDA, MPO, and tGSH levels in blood serum of the study groups. TC, TG, and HG groups were compared with the CIS group (n = 6, ∗P < 0.0001).
Official websites use .gov
A
.gov website belongs to an official
government organization in the United States.
Secure .gov websites use HTTPS
A lock (
) or https:// means you've safely
connected to the .gov website. Share sensitive
information only on official, secure websites.
MDA, MPO, and tGSH levels in blood serum of the study groups. TC, TG, and HG groups were compared with the CIS group (n = 6, ∗P < 0.0001).