Figure 3.

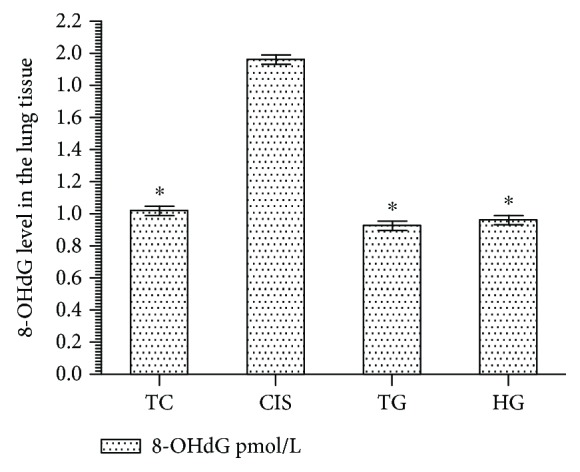
8-OHdG level in lung tissues of the study groups. TC, TG, and HG groups were compared with the CIS group (n = 6, ∗P < 0.0001).

8-OHdG level in lung tissues of the study groups. TC, TG, and HG groups were compared with the CIS group (n = 6, ∗P < 0.0001).