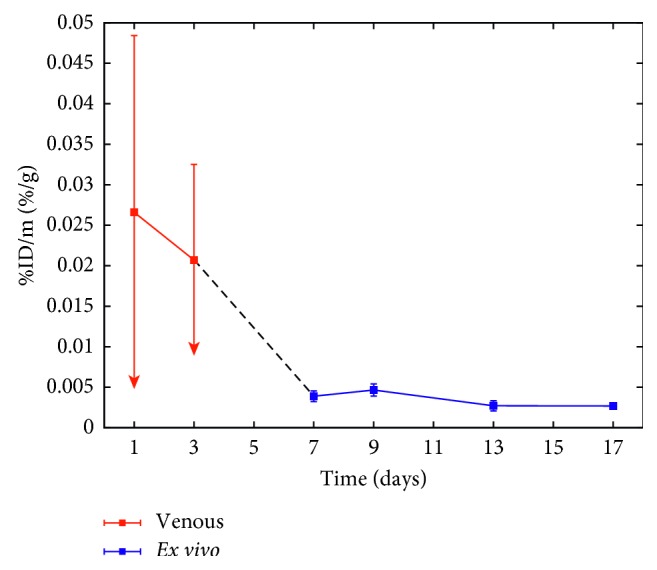
Figure 5.

Combined results of activity in the venous blood (days 1 and 3 indicated in red) and ex vivo (day 7 and further indicated in blue). The data obtained from the venous blood present upper limits of the activity as part of the samples lay beneath the MDA of the HPGe detector, in which case the MDA was used.
