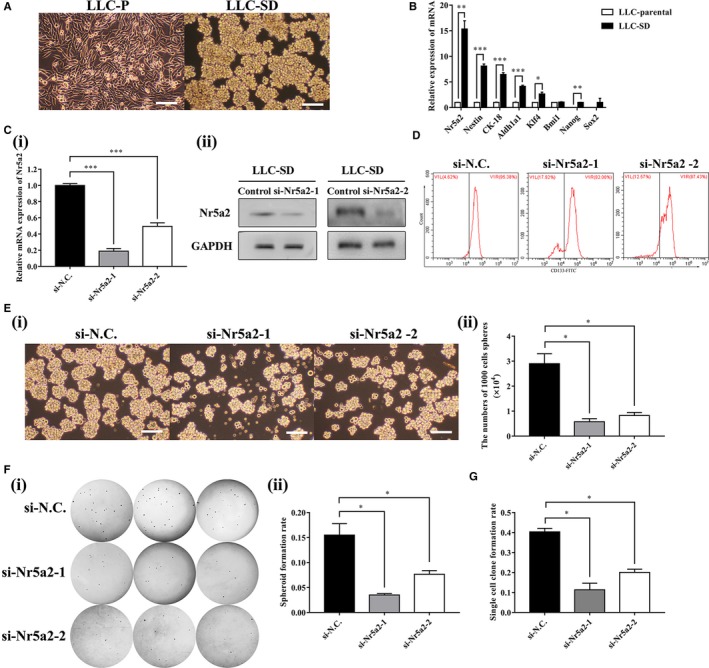
Figure 2.

Nr5a2promotes LLC‐SD self‐renewal in vitro. (A) Cellular morphology of mouse Lewis lung carcinoma parental cells (LLC‐P) compared to mouse Lewis lung carcinoma symmetric division cells (LLC‐SD). Scale bars, 120 μm. (B) RT‐PCR analysis of mRNA expression of stemness markers (Nr5a2, Nestin, CK‐18, Aldh1a1, Klf4, Bmi1, Nanog, and Sox2). TBP was used as the endogenous control, *P < 0.05, **P < 0.01 and ***P < 0.001. (C)(i) Efficiency of two Nr5a2 siRNAs (siNr5a2‐1 and siNr5a2‐2) interference determined by RT‐qPCR, TBP was used as the endogenous control, ***P < 0.001 and by Western blot analysis, using GAPDH as an internal control (ii). (D)the expression of CSCs marker CD133 in LLC‐SD‐siN.C. and LLC‐SD‐siNr5a2(siNr5a2‐1 and siNr5a2‐2) used by flow cytometry (E) (i) The morphology of spheroid formation in LLC‐SD cells transfected with negative control siRNA (siN.C.) and with specific siRNAs of Nr5a2 (siNr5a2‐1 and siNr5a2‐2). Scale bars, 120 μm. (ii) Quantitative analysis of the number of spheroids in 6‐well colony formation assay. Data are presented as mean ± SEM of three independent experiments, *P < 0.05. (F) (i) The morphology of soft agar spheroid formation using LLC‐SD‐siN.C., LLC‐SD‐siNr5a2‐1 and LLC‐SD‐siNr5a2‐2 cells. (ii) Analysis of spheroid formation rate. Data are presented as mean ± SEM of three independent experiments, *P < 0.05. (G) Quantitative analysis of single‐cell cloning formation from LLC‐SD cells transfected with negative control siRNA (siN.C.) and knockdown of Nr5a2 expression with two siRNAs (siNr5a2‐1 and siNr5a2‐2) in which 96 wells were assessed respectively. Data are presented as mean ± SEM of three independent experiments, *P < 0.05
