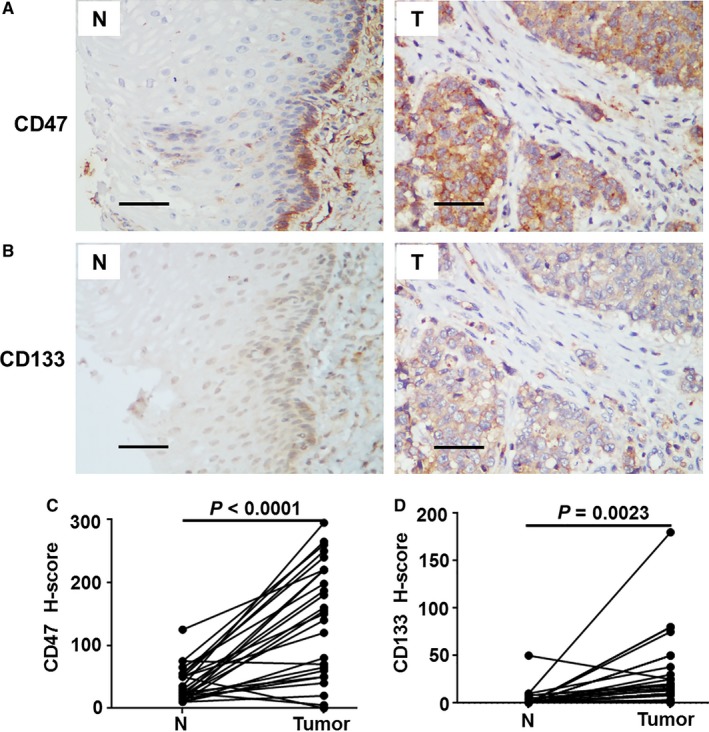
Figure 1.

Characteristics of CD47 and CD133 expression in esophageal squamous cell carcinoma tissues. (A, B) Representative immunohistochemistry (IHC) images of CD47 (A) and CD133 (B) expression in 26 paired (n = 26) tumor (T) and adjacent non‐tumor tissues (N). The scale bar indicates 50 μm. (C, D) Statistical analyses of CD47 and CD133 expression in match paired tumor and adjacent non‐tumor tissues. The IHC H‐scores are shown as a symbol‐line plot from at least two independent pathologists. Differences were assessed with a paired two‐tailed t test
