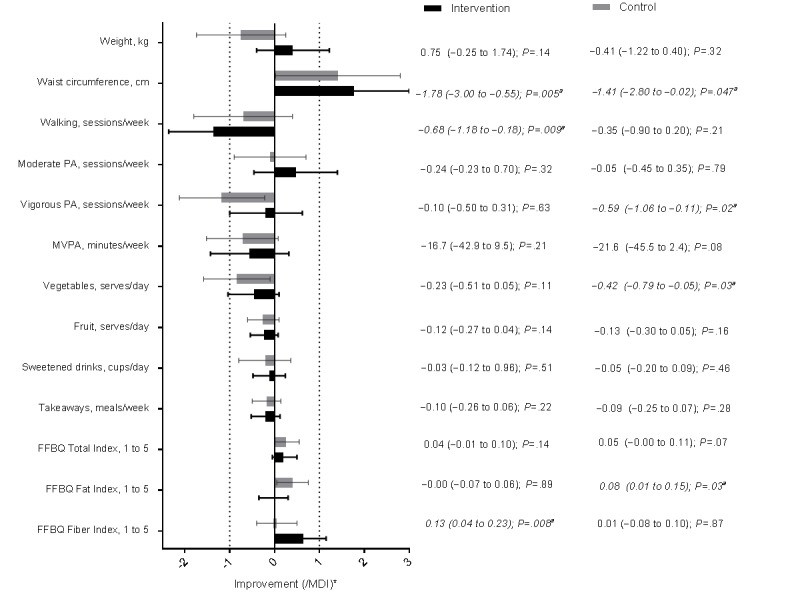
Figure 1.

Mean changes (95% CI) between baseline and 12 months in study outcomes plotted as multiples of the minimum difference of interest (MDI) in the Get Healthy, Stay Healthy (GHSH) intervention (n=114) and control (n=114) groups ("a" indicates significant change P<.05. Asterisk indicates that the x-axis values for the means and CI are displayed as the mean, upper limit, and lower limit divided by the MDI value. Missing data are excluded for the intervention group or control group: n=13/3 [weight], n=14/6 [waist circumference], n=12/3 [self-reported physical activity and diet outcomes], and n=16/9 [accelerometer moderate-to-vigorous physical activity, MVPA]). FFBQ: Fat and Fiber Behavior Questionnaire; PA: physical activity.
