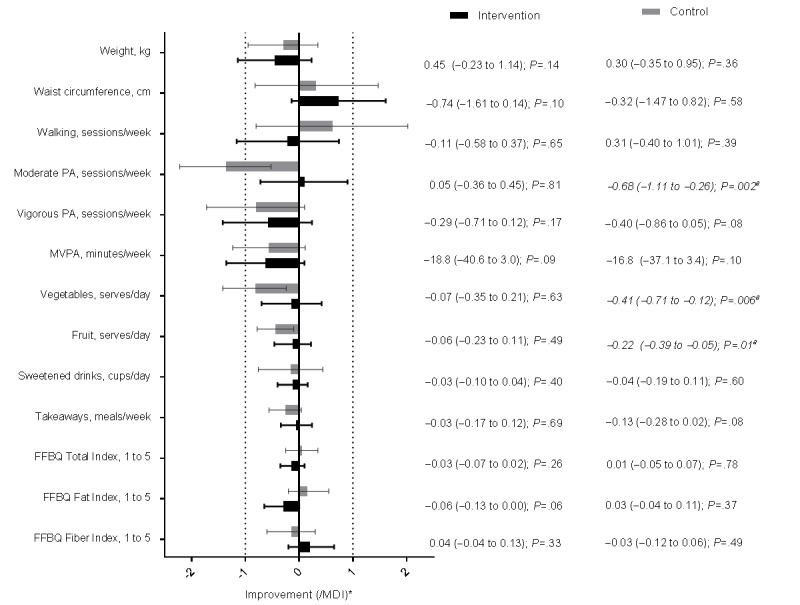
Figure 2.

Mean changes (95% CI) over first 6 months of noncontact in study outcomes plotted as multiples of the minimum differences of interest (MDI) in the Get Healthy, Stay Healthy (GHSH) intervention (n=114) and control (n=114) groups ("a" indicates significant change, P<.05. Asterisk indicates that the x-axis values for the means and CI are displayed as the mean, upper limit, and lower limit by the MDI value). FFBQ: Fat and Fiber Behavior Questionnaire; PA: physical activity.
