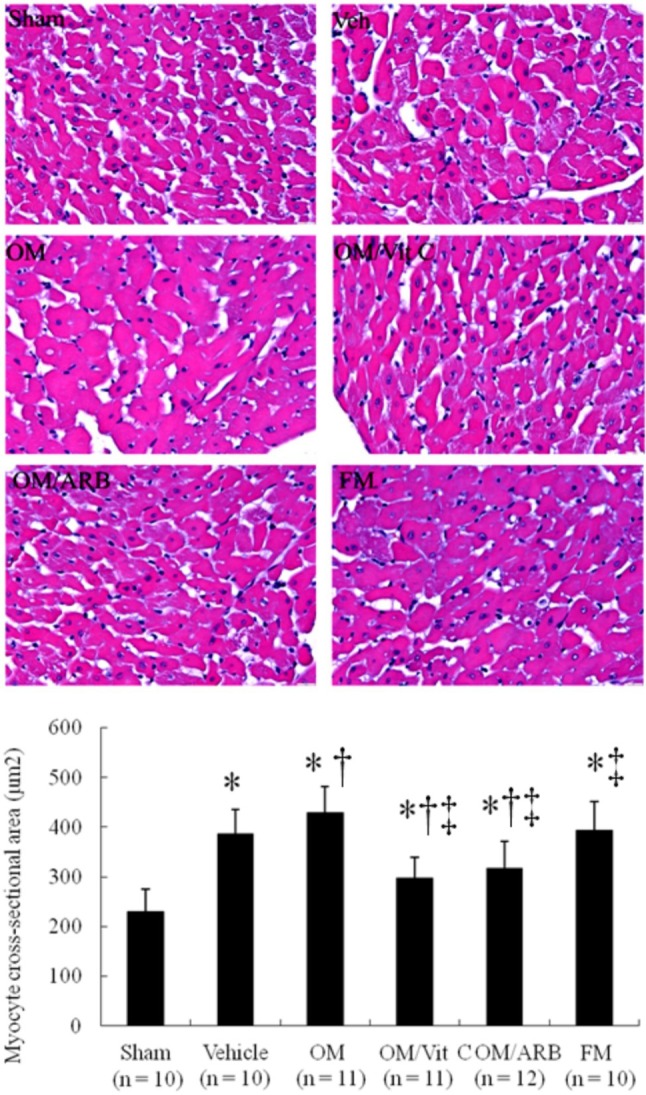
Figure 2.

Cardiomyocyte sizes. Morphometric analyses of LV sections from the border zone at 4 wk after infarction. Bar = 50 μm. Each column and bar represents mean ± SD. The number of animals in each group is indicated in parentheses. ARB, olmesartan; FM, famotidine; OM, omeprazole; Vit C, vitamin C. * p < 0.05, compared with sham; † p < 0.05, compared with vehicle-treated rats; ‡ p < 0.05, compared with OM-treated rats.
