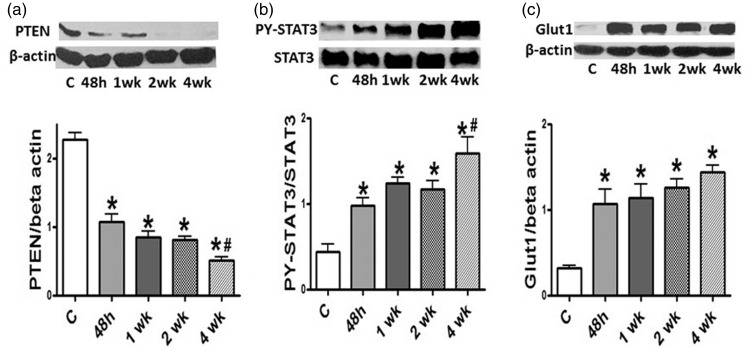
Fig. 6.
(a) A representative western blot and a bar graph depicting the expression of PTEN in the controls and 48 h, and 1, 2, and 4 weeks of hypoxia (n = 3–7). Significant reduction in PTEN expression is present at 48 h, and 1 and 2 weeks of hypoxia, and a further reduction at 4 weeks. (b) A western blot and bar graph depicting the expression of PY-STAT3 and STAT3 in the controls and 48 h, 1, 2, and 4 weeks of hypoxia (n = 5–7). Significant activation of PY-STAT3 is present at 48 h, and 1 and 2 weeks of hypoxia. There is a further increase in PY-STAT3 activation at 4 weeks of hypoxia. (c) A representative western blot and a bar graph depicting the expression of Glut1 in controls and 48 h, and 1, 2, and 4 weeks of hypoxia (n = 4–5). Significant increase in the expression of Glut1 is present at 48 h, 1, 2, and 4 weeks of hypoxia. *P < 0.05 vs. controls (C), #P < 0.05 vs. 48 h group.

