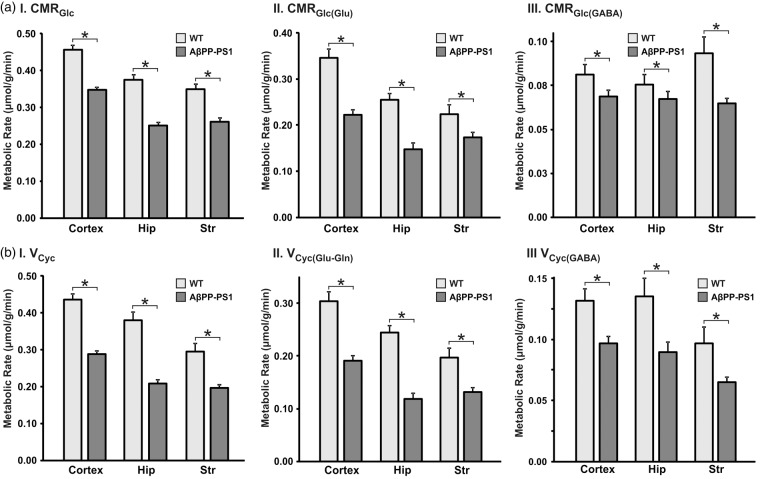
Figure 6.
Metabolic rates in AβPP-PS1 and WT mice. (a.I) Cerebral metabolic rate of glucose oxidation; (a.II) Rate of glucose oxidation in glutamatergic neurons; (a.III) rate of glucose oxidation in GABAergic TCA cycle; (b.I) neurotransmitter cycle; (b.II) glutamate-glutamine cycle; (b.III) GABA-glutamine cycle. Metabolic rates were determined by fitting a three compartment model to the measured 13C turnover of amino acids from [1,6-13C2]glucose. Values represent mean ± SEM. *p < 0.001.

