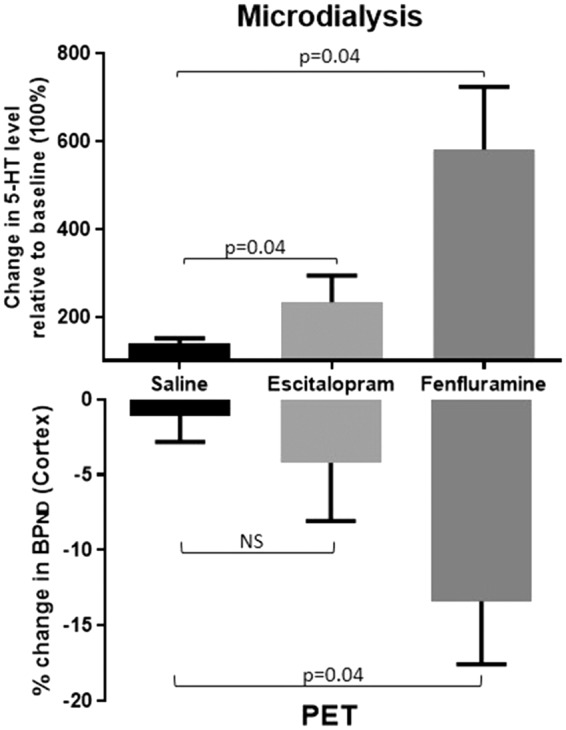
Figure 2.

Changes in brain interstitial 5-HT levels (upper panel) and BPND (lower panel) following a within-scan challenge of saline (n = 10), escitalopram (n = 5), or fenfluramine (n = 5). The upper panel shows the changes in the peak interstitial cerebral 5-HT level relative to baseline (100 %) ± SEM as measured by microdialysis in the mPFC. The lower panel shows the relative decrease in BPND as measured by PET in the pig brain neocortex. Changes were statistically evaluated by comparing the escitalopram and fenfluramine interventions to saline with Wilcoxon signed-rank test.
