
Figure 4.
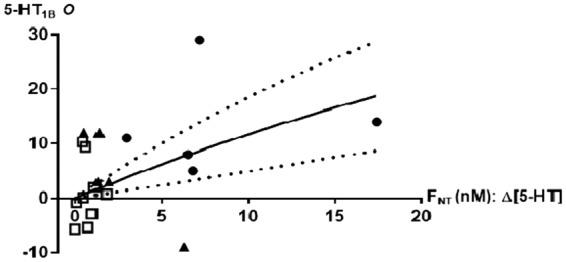
Relationship between relative increase in brain interstitial 5-HT levels (ΔFNT) and neocortical 5-HT1B receptor occupancy O (%) with 95% confidence intervals. Interventions include saline (square), escitalopram (filled triangle), and fenfluramine (filled circle). Data are based on 10 pigs with two PET scans and are fitted with nonlinear regression analysis according to equation (1), resulting in a KNT of 74 nM.