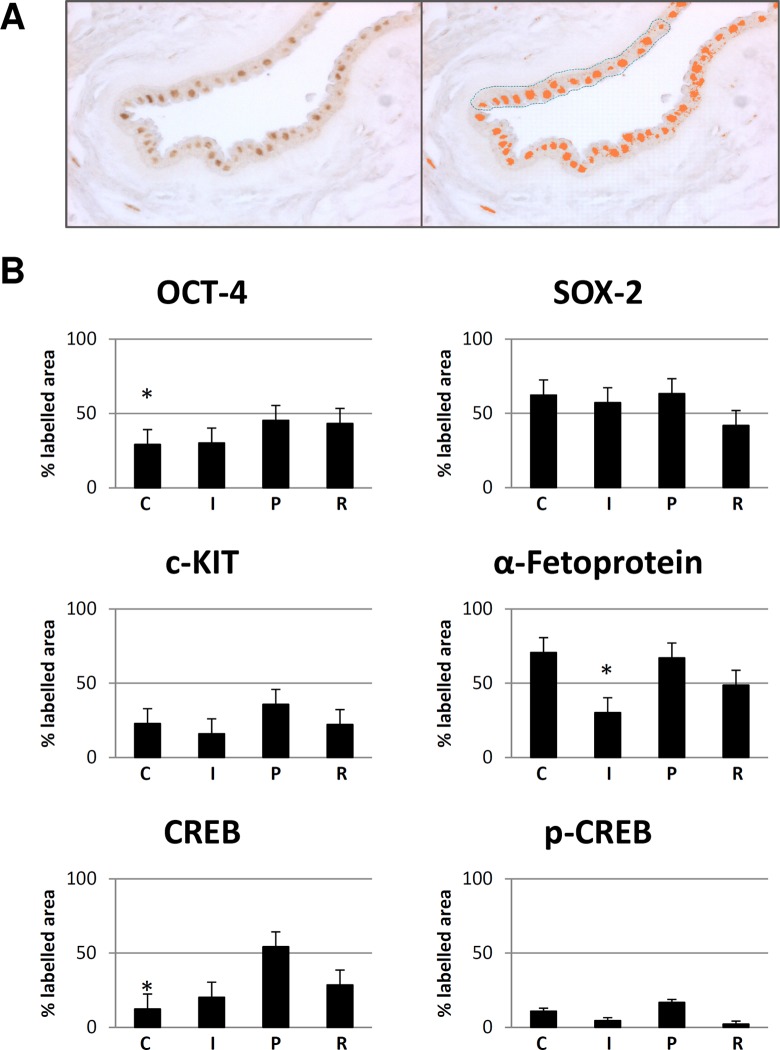
Figure 3.
Quantification and statistical analysis of immunohistochemical reactions. (A) Light microscopy image representative of the method used for quantitative analysis of the immunohistochemical reactions with MetaMorph analysis software (original magnification: ×40). The selected area for each sample was 3,000 μm2. (B) Bar graph representation of the immune labeling for OCT-4, SOX-2, c-KIT, α-fetoprotein, CREB, and p-CREB in the central (C), intermediate (I), peripheral (P), and reflected (R) areas of the amniotic membrane. Values reported in the bar graphs are the means ± standard deviation (SD) of labeled area from at least 3 different experiments.*P < 0.05: OCT-4 central area versus peripheral area, α-fetoprotein intermediate area versus peripheral area, and CREB central area versus peripheral area.

